

Bitcoin bulls could be on to something splendid after price printed a bullish reversal pattern on Thursday, days after losing grip of the $53,000 support.
According to Mathew Hayland, a seasoned crypto technical and on-chain analyst, Bitcoin’s price is slowly forging a pattern that could ignite a spirited bullish run once various conditions are met.
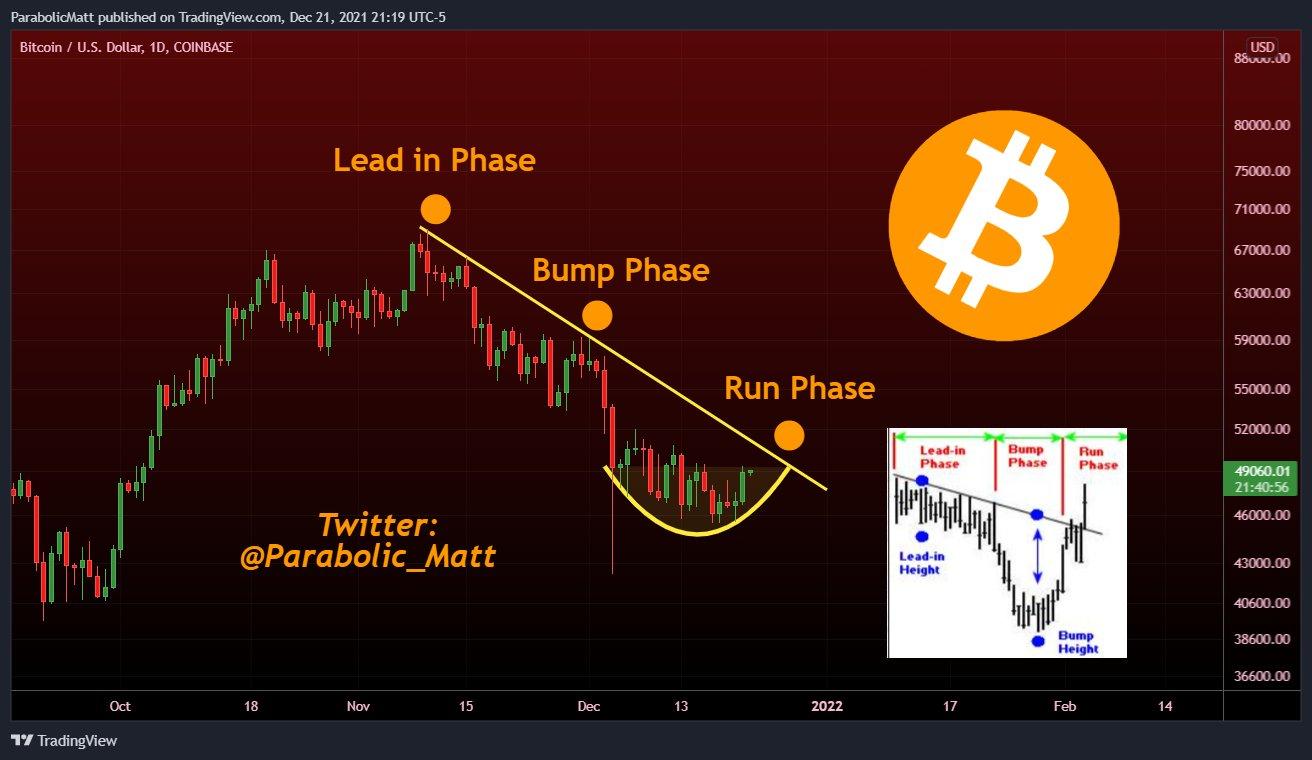
Referring to the figure below, he tweeted on Wednesday, “Bump and Run Reversal Bottom continues to be in play as the “Frying Pan” bottom continues to form”.
According to him, Bitcoin’s date with higher prices depends on price breaking and closing above the yellow resistance trendline which will usher price into the “run phase”.
Termed as a “highly effective” chart pattern, the bump-and-run reversal bottom (BARR) forms towards the end of a pullback, indicating the continuation of an existing larger trend. According to stats, the pattern has a low break-even failure rate and has proven to be pretty dependable when price breaks out.
But that is not all, the pundit also brings to our attention some glaring on-chain insights showing that Bitcoin is on the path to recovery.
Bullish Divergence By SOP Indicator
For example, he shares a chart showing that the percentage of Supply in Profit (SOP) in exchanges formed a huge Bullish Divergence. According to him, this divergence is a result of a reduction in the number of people in profit compared to September. He however sees this as highly indicative of a possible turnaround as the price seems to have bottomed out and more people are buying at the asset’s current levels.
Mathew also shares a chart showing the 140-day Delta Gradient flipping positive in a situation similarly witnessed in October 2020 which was followed by a huge 189-day uptrend.
“When the 140-day Delta Gradient flips positive, it indicates an expected uptrend is in play for AT LEAST 140 days from the flip point,” he says.
Old Hands Accumulating
Despite Bitcoin selling off after price printed an all-time high in November, thanks to an avalanche of setbacks, data shared by Glassnode indicates that Bitcoin supply is moving from a liquid to an illiquid state at a rate of 100k $BTC per month.
Illiquid coins are those sent to an address with little history of spending and are generally associated with investor accumulation and bull market buyers. This has been ongoing for a while despite exchanges facing a temporary rise in inflows in the past one month which is believed to have ignited the sell-off.
That said, the dust seems to have settled for the cryptocurrency with price printing bullish candles for three consecutive days, igniting hopes for a sustained bull-run. At reporting time, Bitcoin is trading at $50,981 with the daily stochastic oscillator exhibiting a decent recovery.


